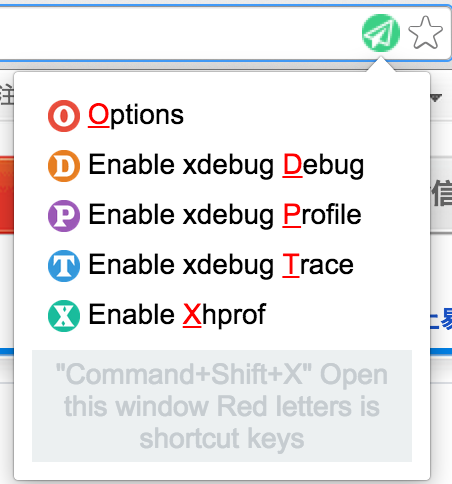
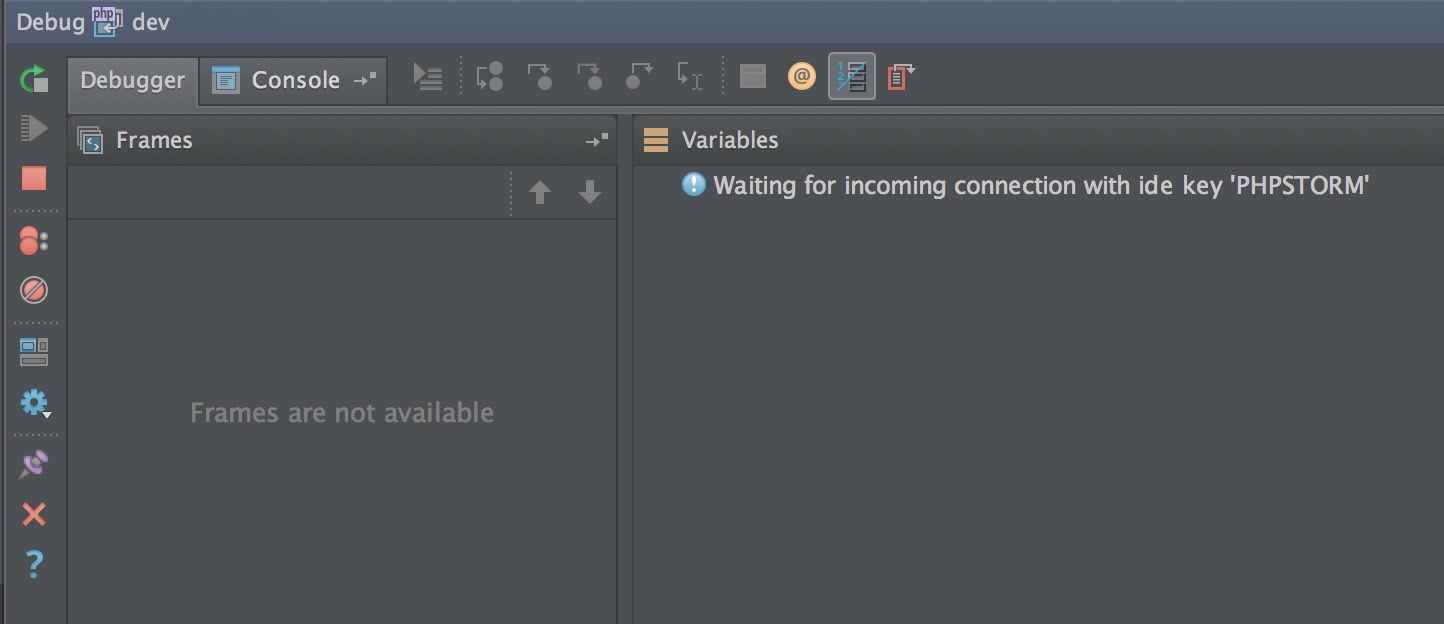
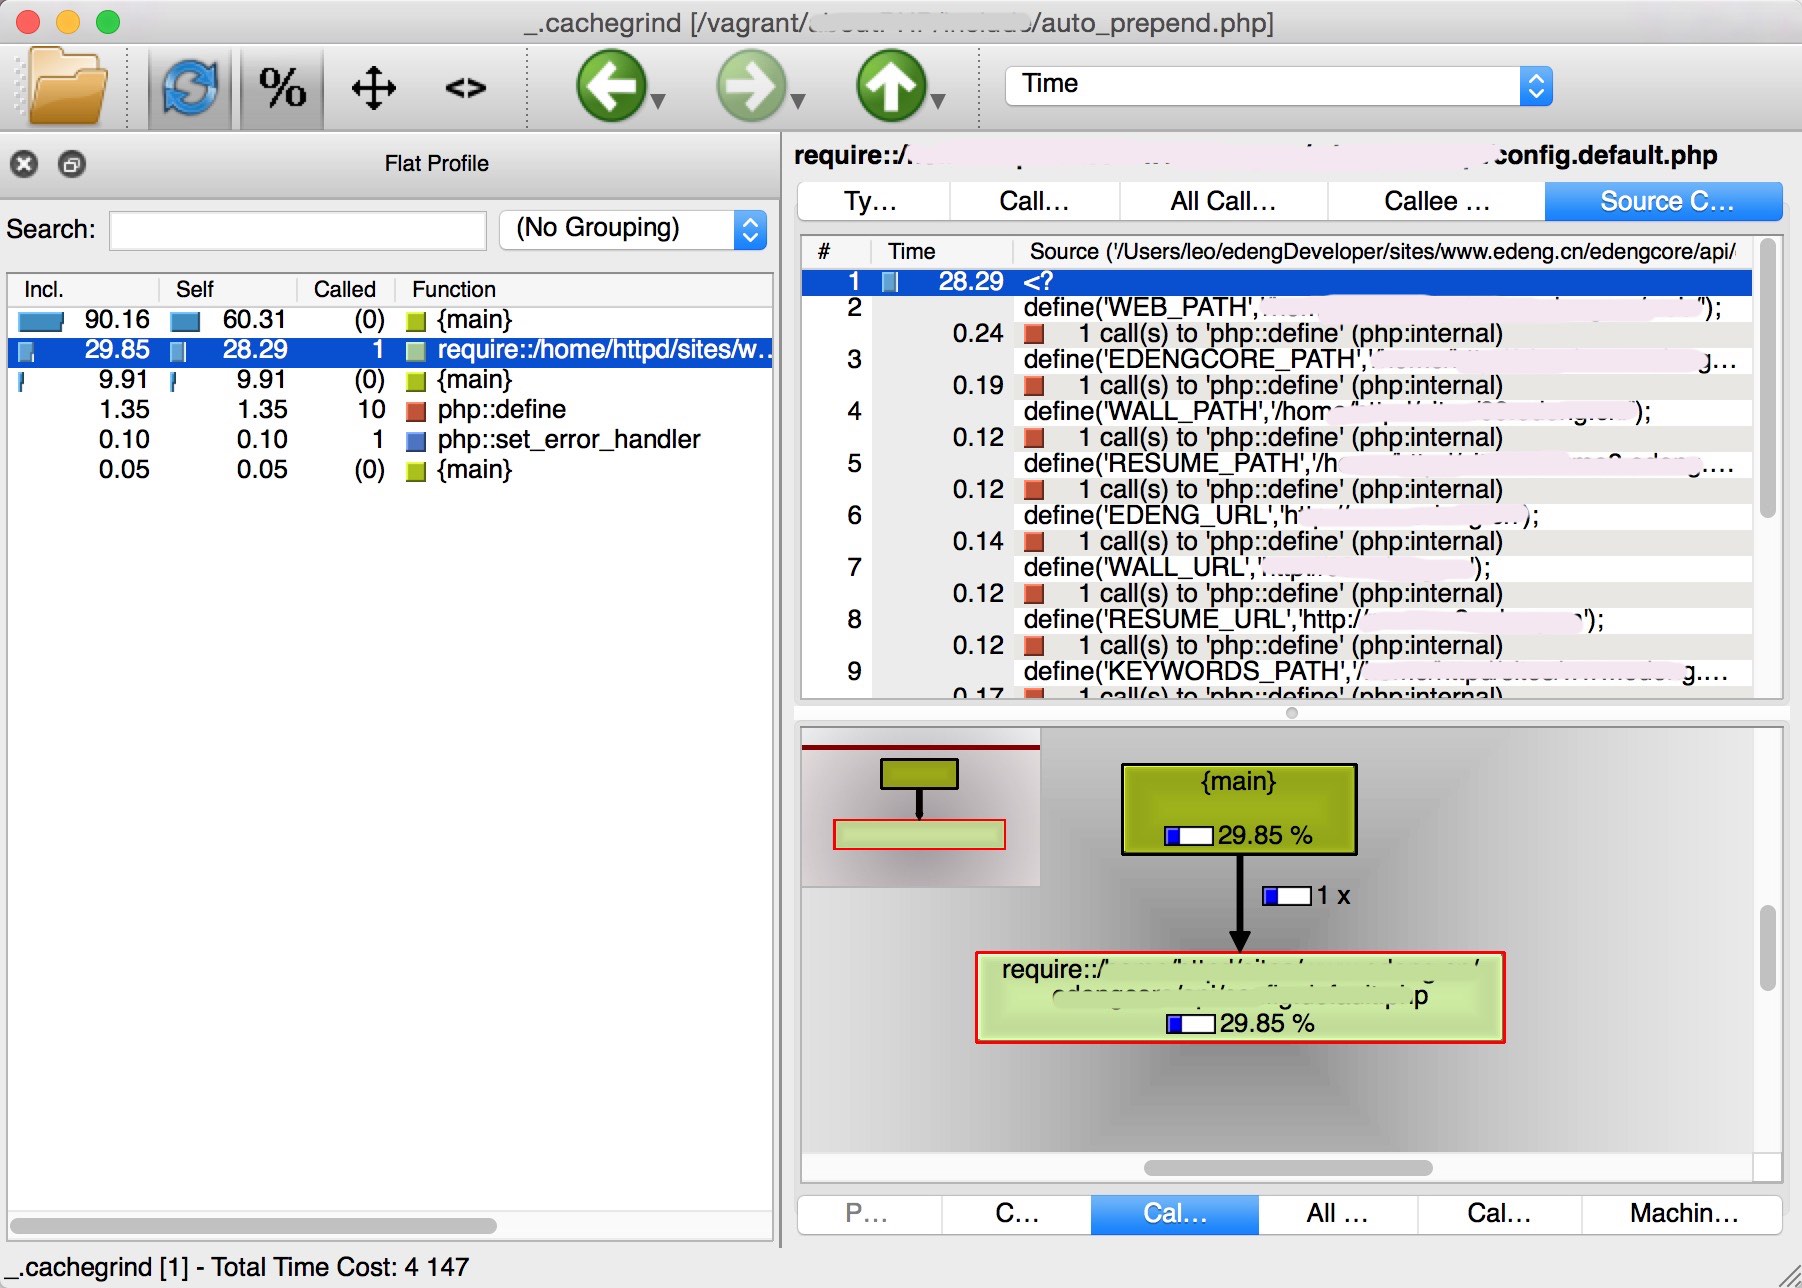
末日前几天

the days before Doomsday

How to Use Xdebug and LLDT to Debug Your PHP Code With Vagrant and PHPStrom

主要用到的软件

  • PhpStorm PHP 开发 IDE
  • Xdebug PHP debug 插件
  • Xhprof Facebook 出品的 PHP 性能测量插件
  • LLDT-chrome-plugin 自己写的一个 Chrome 浏览器插件,集成了xdebugHelper,并添加了更多的选项。
  • Vagrant 一款可以管理 VirtualBox 虚拟机的软件。
  • VirtualBox 一款夸平台的虚拟机软件。
  • Nginx web 服务器软件(运行在虚拟机中)
  • PHP-FPM php 运行管理(运行在虚拟机中)

Vbox & Vagrant 虚拟环境介绍

下载地址

直接运行安装包进行安装。 安装包里同时包含了卸载脚本,如果想卸载的话,直接运行就可以了。

相关目录

在 Mac 平台下:Vbox的虚拟机默认保存路径为~/VirtualBox VMsVagrant用户的数据文件保存在~/.vagrant.d目录下面,删除这个目录将删除vagrant的所有boxplugins

什么是Box?

box 就相当于是一个环境,它一般是一个 Vbox 虚拟机的镜像,官方提供了一个基于 Ubuntu 的box。 给vagrant添加一个 Box 的命令, 打开 Terminal

1
2
3
4
5
6
7
8
9
vagrant box add Ubuntu12.04 http://files.vagrantup.com/precise32.box

# Ubuntu12.04 的含义是虚拟机的名字.
# 上面的命令会下载 http://files.vagrantup.com/precise32.box ,并添加到 ~/.vagrant.d/boxes/Ubuntu12.04 下
# 也可以直接将box下载下来,然后添加,需要执行:
vagrant box add Ubuntu12.04 /the/path/for/your/precise32.box

#查看本机安装的 box 列表
vagrant box list

怎样使用 Vagrant 管理 Vbox 虚拟机

  • 初始化 Vagrant 环境,下面这个命令会在当前目录下面创建一个 Vagrant 使用的配置文件 Vagrantfile ,里面包含了 Vagrant 启动需要的配置。
1
vagrant init YOUR_BOX_NAME
  • 开启 VirtualBox 虚拟机,下面这个命令,会创建一个新的 VirtualBox 的虚拟机。
1
vagrant up
  • 关闭 VirtualBox 虚拟机
1
vagrant halt
  • 挂起 VirtualBox 虚拟机,下次开机时间很短,非常快,但是占用更多的内存和硬盘空间。
1
vagrant suspend
  • 恢复 VirtualBox 虚拟机, 将虚拟机恢复到初始状态.
1
vagrant destroy
  • 登陆 VirtualBox 虚拟机
1
vagrant ssh

自己从官网下载一个 box,安装上后,我们开始讲正题。

启动软件环境

进入到你 Web 项目的根目录,手工创建Vagrantfile配置文件,或者也可以使用vagrant ini创建后再手工修改,添加了一个用来跟虚拟机通信的独立的 IP。

下面是 Vagrantfile 的内容:

1
2
3
4
5
6
7
8
9
10
11
12
13
# -*- mode: ruby -*-
# vi: set ft=ruby :

# Vagrantfile API/syntax version. Don't touch unless you know what you're doing!
VAGRANTFILE_API_VERSION = "2"

Vagrant.configure(VAGRANTFILE_API_VERSION) do |config|
    config.vm.box = "edengdev-CentOS6.4x86_64"
    config.vm.network "private_network", ip: "192.168.168.168"
    config.vm.provider "virtualbox" do |vb|
        vb.customize ["modifyvm", :id, "--memory", "1024"]
    end
end

然后运行下面的命令,开启,并登陆进虚拟机里

1
2
3
4
5
6
7
8
9
10
11
vagrant up
vagrant ssh

#创建待会需要用的目录
mkdir -p /var/log/php/xdebug/trace_output
mkdir -p /var/log/php/xdebug/profiler_output
mkdir -p /var/log/php/xhprof/xhprof_data
mkdir -p /etc/php/include

#修噶 hosts 文件,这样可以直接访问网址 「http://me.dev」来进行本机开发了。
sudo  echo "me.dev 192.168.168.168"  >> /etc/hosts

在虚拟机中安装好NginxPHP-FPMXdebugXhprof,这个过程就不过多的介绍了。

下面是我的 Xdebug 配置文件样例:

1
2
3
4
5
6
7
8
9
10
11
12
13
14
15
16
17
18
19
20
21
22
23
24
25
26
27
28
29
30
31
32
33
34
35
36
37
38
39
40
41
42
43
44
45
46
47
48
49
50
51
52
53
54
55
56
57
58
59
60
61
62
63
64
65
66
67
68
69
70
71
72
73
74
75
76
77
78
79
80
81
;;;;;;;;;;;;;;;;;;;;;;
; xdebug             ;
;;;;;;;;;;;;;;;;;;;;;;
[xdebug]
; 这里要求必须是绝对路径,不能是相对路径 see:
; http://stackoverflow.com/questions/1758014/whats-the-difference-between-extension-and-zend-extension-in-php-ini
zend_extension="/usr/local/php/lib/php/extensions/no-debug-non-zts-20090626/xdebug.so"
;;;;;;;;;;;;;;;;;;;;;;;;;;;;;;;;;;;;;;;;;;;;;;;;;;;;;;;;;;;;;;;;;;;;;
;;;;;;;;;;;;;;;;;;;;;;;;;;;;;;;;;;;;;;;;;;;;;;;;;;;;;;;;;;;;;;;;;;;;;
;;;;     All API Docs At http://xdebug.org/docs/all_settings     ;;;;
;;;;;;;;;;;;;;;;;;;;;;;;;;;;;;;;;;;;;;;;;;;;;;;;;;;;;;;;;;;;;;;;;;;;;
;;;;;;;;;;;;;;;;;;;;;;;;;;;;;;;;;;;;;;;;;;;;;;;;;;;;;;;;;;;;;;;;;;;;;

xdebug.overload_var_dump=On
; 强制指定显示错误,不管php.ini的设置
xdebug.force_display_errors=On
xdebug.force_error_reporting=On

; If this setting is 1, then stacktraces will be shown by default on an error event.
; You can disable showing stacktraces from your code with xdebug_disable().
; As this is one of the basic functions of Xdebug, it is advisable to leave this setting set to 1.
xdebug.default_enable=1

; don't use coverage function
xdebug.coverage_enable=Off

;;;;;;;;;;;;;;;;;;;;;;;;;;;;;;;;;;;;;;;;;;;;;;;;;;;;;;;;
;;                 Stack Traces                       ;;
;;;;;;;;;;;;;;;;;;;;;;;;;;;;;;;;;;;;;;;;;;;;;;;;;;;;;;;;
;;       http://xdebug.org/docs/stack_trace           ;;
;;;;;;;;;;;;;;;;;;;;;;;;;;;;;;;;;;;;;;;;;;;;;;;;;;;;;;;;
xdebug.collect_params=3
xdebug.collect_return=Off
; xdebug.collect_vars=On
; xdebug.dump_globals=On
; xdebug.dump.SERVER="REQUEST_URI"

;;;;;;;;;;;;;;;;;;;;;;;;;;;;;;;;;;;;;;;;;;;;;;;;;;;;;;;;
;;            Function Trace                          ;;
;;;;;;;;;;;;;;;;;;;;;;;;;;;;;;;;;;;;;;;;;;;;;;;;;;;;;;;;
;;     http://xdebug.org/docs/execution_trace         ;;
;;;;;;;;;;;;;;;;;;;;;;;;;;;;;;;;;;;;;;;;;;;;;;;;;;;;;;;;
xdebug.auto_trace=Off
xdebug.collect_includes=On
;显示内存信息,在trace的时候
xdebug.show_mem_delta=On
xdebug.trace_enable_trigger=On
xdebug.trace_output_dir="/var/log/php/xdebug/trace_output"
;指定trace输出文件的格式, 0 是文本文件,1 计算机可读格式, 2 html格式
xdebug.trace_format=0
;When set to '1' the trace files will be appended to, instead of being overwritten in subsequent requests.
xdebug.trace_options=0
;指定trace输出文件名的格式, %R Meaning $_SERVER['REQUEST_URI']
xdebug.trace_output_name=trace.%R


;;;;;;;;;;;;;;;;;;;;;;;;;;;;;;;;;;;;;;;;;;;;;;;;;;;;;;;;
;;            Profiling Script                        ;;
;;;;;;;;;;;;;;;;;;;;;;;;;;;;;;;;;;;;;;;;;;;;;;;;;;;;;;;;
;;        http://xdebug.org/docs/profiler             ;;
;;;;;;;;;;;;;;;;;;;;;;;;;;;;;;;;;;;;;;;;;;;;;;;;;;;;;;;;
xdebug.profiler_enable=Off
xdebug.profiler_output_dir="/var/log/php/xdebug/profiler_output"
xdebug.profiler_enable_trigger=On
;profiler文件是追加,还是重写
xdebug.profiler_append=Off
xdebug.profiler_output_name=%R.cachegrind


;;;;;;;;;;;;;;;;;;;;;;;;;;;;;;;;;;;;;;;;;;;;;;;;;;;;;;;;
;;              Remote Debugging                      ;;
;;;;;;;;;;;;;;;;;;;;;;;;;;;;;;;;;;;;;;;;;;;;;;;;;;;;;;;;
;;        http://xdebug.org/docs/remote               ;;
;;;;;;;;;;;;;;;;;;;;;;;;;;;;;;;;;;;;;;;;;;;;;;;;;;;;;;;;
xdebug.remote_handler=dbgp
xdebug.remote_autostart=Off
xdebug.remote_enable=1
xdebug.remote_host=192.168.192.1
xdebug.remote_port=9000
xdebug.remote_mode=req
;xdebug.remote_log=""

下面是我的 Xhprof 的配置样例:

首先,将 Xhprof 自带的 xhprof_html, xhprof_lib 目录放入到 /var/log/php/xhprof/ 下。

1
2
3
4
5
6
7
8
9
10
11
12
13
;;;;;;;;;;; add the following configuration to php.ini ;;;;;;;;;;;;;;;;;;;;;;;;;;;
auto_prepend_file = "/etc/php/include/auto_prepend.php"
auto_append_file  = "/etc/php/include/auto_append.php"
; Xhprof Module
[xhprof]
xhprof.output_dir = /var/log/php/xhprof/xhprof_data

;;;;;;;;;;; add the following configuration to php-fpm.conf ;;;;;;;;;;;;;;;;;;;;;
;#### for xhprof
php_admin_value[extension] = xhprof.so
env[XHPROF_ROOT_PATH] = /var/log/php/xhprof
# 采样百分比,多少次访问后性能采样一次
env[XHPROF_SAMPLING_PERCENTAGE] = 3000

下面是 /etc/php/include/auto_prepend.php 的内容:

1
2
3
4
5
6
7
8
9
10
11
if(isset($_SERVER['XHPROF_ROOT_PATH'])){
    // start profiling
    // options: xhprof_enable(  XHPROF_FLAGS_CPU + XHPROF_FLAGS_MEMORY + XHPROF_FLAGS_NO_BUILTINS );
    $xhprof_on = false;
    //if ($_SERVER['REQUEST_METHOD'] == 'POST'){
        if ( function_exists('xhprof_enable')  && ( ( mt_rand(1, $_SERVER['XHPROF_SAMPLING_PERCENTAGE']) == 1 ) || isset( $_REQUEST['XHPROF_PROFILE'] ) ) ) {
            xhprof_enable(XHPROF_FLAGS_NO_BUILTINS + XHPROF_FLAGS_MEMORY);
            $xhprof_on = true;
        }
    //}
}

下面是 /etc/php/include/auto_append.php 的内容:

1
2
3
4
5
6
7
8
if ($xhprof_on){
    $xhprof_data = xhprof_disable();
    include_once $_SERVER['XHPROF_ROOT_PATH'] . "/xhprof_lib/utils/xhprof_lib.php";
    include_once $_SERVER['XHPROF_ROOT_PATH'] . "/xhprof_lib/utils/xhprof_runs.php";
    $xhprof_runs = new XHProfRuns_Default();
    $xhporf_script_name= str_replace('.','^', substr(str_replace('/', '_', $_SERVER['SCRIPT_FILENAME']),1) );
    $run_id = $xhprof_runs->save_run( $xhprof_data, $xhporf_script_name , date('YmdHis').substr((string)microtime(), 2, 8));
}

设置 PhpStorm

我使用的 IDE 软件为 PhpStorm,要配合使用 Vagrant 的话,还需要特殊配置一下。

1.Create New Project

phpstorm-1

2. Edit Configrations…

Run > Edit Configrations… > Defaults > PHP Remote Debug > Servers phpstorm-4

因为使用 Vagrant 的缘故,所以调试 PHP 代码的时候,需要配置目录映射。

1
# your/sites/path            -->  /vagrant

phpstorm-5

3.Debug

勾选, Run > “Break at first line in PHP scripts” 后,点击 “Debug ‘xxxxx’ phpstorm-6 phpstorm-7

Chrome 浏览器的插件 LLDT

chrome 安装 LLDT 后,打开你开发的网址http://me.dev, 刷新一下。会看到地址栏的LLDT图标,点击一下,或者按快捷键Ctrl+Shift+X,mac用户为command+Shift+x,调出菜单弹窗。 phpstorm-8

Enable Xdebug debug

点击Enable Xdebug debug,或者按快捷键 D, 刷新网页。 返回PhpStorm程序,应该已经开启debug了。 phpstorm-9

Enable Xdebug Profile

Xdebug Profile 功能可以对HTTP请求页面对应的脚本性能进行分析,并将分析数据保存到文件中。

  • Mac 用户可以安装 qcachegrind ,来观看Profilling保存的数据文件,brew install qcachegrind
  • Windows 用户可以安装 WinCacheGrind, 或者 KCacheGrind, 来观看。

找到Chrome浏览器地址栏的LLDT图标,点击一下,或者按快捷键Ctrl+Shift+X,mac用户为command+Shift+x,调出菜单弹窗,点击Enable Xdebug Profile,或者按快捷键 P, 刷新网页就可以了。

Profile 的数据文件存储在了,/var/log/php/xdebug/profiler_output 目录中。 mac下查看分析结果,安装完qcachegrind,将数据文件 copy 出来,打开 Terminal,运行qcachegrind xxxx.cachegrind 命令,查看相应地xxxx数据文件。

例如: phpstorm-10

Enable Xdebug Trace

Xdebug Trace 功能可以对HTTP请求页面对应的脚本执行过程的函数调用进行记录,并将记录结果保存到文件中。

找到 Chrome 浏览器地址栏的 LLDT 图标,点击一下,或者按快捷键Ctrl+Shift+X,mac用户为command+Shift+x,调出菜单弹窗,点击Enable Xdebug Trace,或者按快捷键 T, 刷新网页就可以了。

保存的数据文件存储在了,/var/log/php/xdebug/trace_output 目录中。 直接可以用你自己喜欢的文本编辑器查看分析结果。

Enable Xhprof

Xhprof 为 Facebook 出品的分层PHP性能分析工具。 可以对 PHP脚本的执行进行性能分析。并将记录结果保存到文件中。

找到 Chrome 浏览器地址栏的 LLDT 图标,点击一下,或者按快捷键Ctrl+Shift+X,mac用户为command+Shift+x,调出菜单弹窗,点击Enable Xhprof,或者按快捷键 X, 刷新网页就可以了。

保存的数据文件存储在了,/var/log/php/xhprof/xhprof_data 目录中。 xhprof 的分析结果怎么查看, 自己查看官网的介绍吧。

Comments